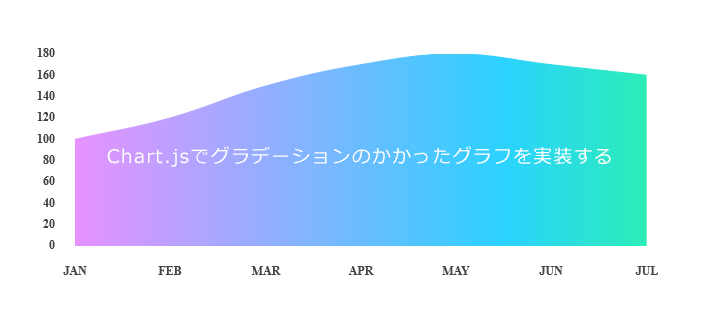
Chart.jsでグラデーションのかかったグラフを実装する

今回は、円グラフや棒グラフなど様々なグラフをjsで書くことができるChart.jsを使って、グラデーションのかかった折れ線グラフを実装するサンプルコードを紹介します。
デモ
See the Pen by mizusawa (@webty_mizusawa) on CodePen.
サンプルコード
html
<canvas id="myChart"></canvas>js
var data = [100, 120, 150, 170, 180, 170, 160];
var labels = ["JAN", "FEB", "MAR", "APR", "MAY", "JUN", "JUL"];

drawLineChart
    "myChart", // elemet.id
    data, // data
    labels, // labels
    "#FA8BFF", // firstColour
    "#2BD2FF", // secondColour
    "#2BFF88" // thirdColour
);

function drawLineChart(id, data, labels, firstColour, secondColour, thirdColour) {
    var ctx = document.getElementById(id).getContext("2d");
    var width = window.innerWidth || document.body.clientWidth;
    var gradientStroke = ctx.createLinearGradient(0, 0, width, 0);
    gradientStroke.addColorStop(0, firstColour);
    gradientStroke.addColorStop(0.6, secondColour);
    gradientStroke.addColorStop(0.9, thirdColour);

    var myChart = new Chart(ctx, {
        type: "line",
        data: {
            labels: labels,
            datasets: [
                {
                    label: "Data",
                    borderColor: gradientStroke,
                    pointBorderColor: gradientStroke,
                    pointBackgroundColor: gradientStroke,
                    pointHoverBackgroundColor: gradientStroke,
                    pointHoverBorderColor: gradientStroke,
                    pointBorderWidth: 8,
                    pointHoverRadius: 8,
                    pointHoverBorderWidth: 1,
                    pointRadius: 0,
                    backgroundColor: gradientStroke,
                    borderWidth: 1,
                    data: data
                },
            ]
        },
        options: {
            responsive: true,
            maintainAspectRatio: false,
            legend: {
                position: "none"
            },
            scales: {
                yAxes: [
                    {
                        ticks: {
                            fontFamily: "Roboto Mono",
                            fontColor: "#444",
                            fontStyle: "bold",
                            beginAtZero: true,
                            padding: 20
                        },
                        gridLines: {
                            drawTicks: false,
                            display: false,
                            drawBorder: false
                        }
                    }
                ],
                xAxes: [
                    {
                        gridLines: {
                            zeroLineColor: "transparent"
                        },
                        ticks: {
                            fontFamily: "Roboto Mono",
                            fontColor: "#444",
                            fontStyle: "bold",
                            beginAtZero: true,
                            padding: 20
                        },
                        gridLines: {
                            drawTicks: false,
                            display: false,
                            drawBorder: false
                        }
                    }
                ]
            }
        }
    });
}addColorStopの辺りを変更すれば、グラデーションの具合などを変更することができます。
